Interpretation of real-time PCR vs PathoSense results
Written by Dr. Sebastiaan Theuns
In the past decade, real-time or quantitative PCR has become one of the most frequently used techniques to assess the presence of pathogens in veterinary diagnostic samples. Quantitative PCR or shortly qPCR is based on targeted amplification of a very specific and short (75-150bp) region of the pathogen genome. It means that as a veterinarian you will always have to make a prior selection of what you want to test for. In contrast, PathoSense is a novel technology based on ad-random nanopore sequencing of pathogen genomes, without requiring prior selection. Both techniques target genetic material but the interpretation is different. Here we give a short refreshment about both methodologies and their interpretation.

The qPCR technique explained
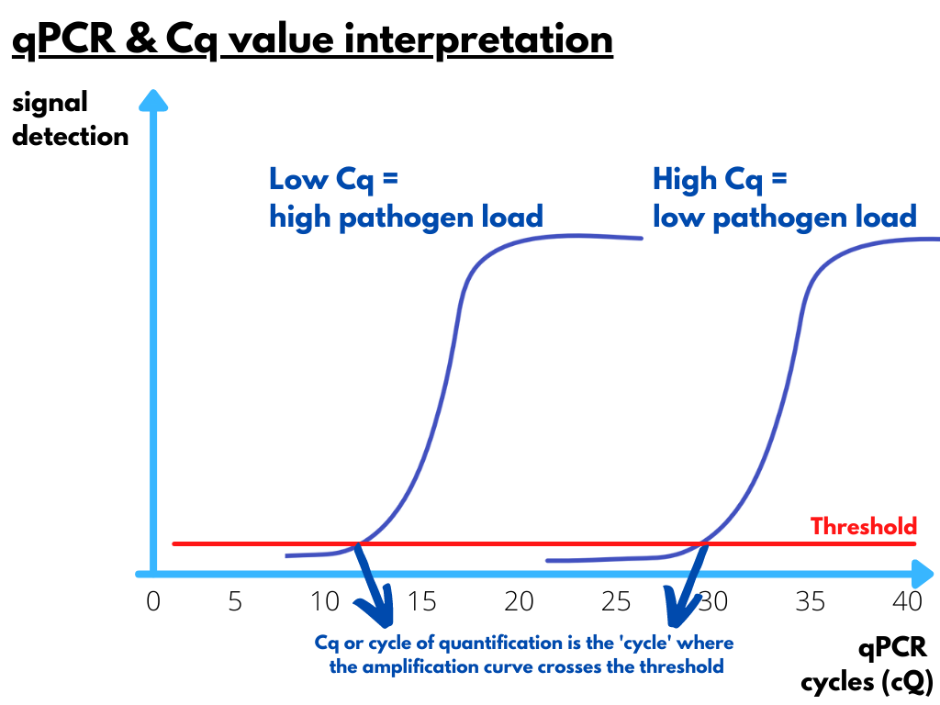
To target specific pathogen sequences, scientists have to design very specific primers or stretches of +-20 nucleotides that are identical to the pathogens or strains of interest. However, pathogens mutate continuously, which means that primers that have been designed today will not necessarily still function the next year. One or two mutations in the binding-site of the primer to the pathogen genome can already hamper the real-time PCR efficiency and lead to a false-negative result. Why do we need these primers? They are an anchor point or starting point for the polymerase enzyme to duplicate the region of interest in a repetitive process of 40 cycles. Each cycle of a well-designed qPCR consists of only two steps. The first step is the denaturation or separation of the double-stranded DNA strands and occurs at a very high temperature, namely 95°C. The second step is the annealing phase for which the temperature is lowered to around 60°C. At this lower temperature, the primers will now be able to bind to the specific region of interest, one at the 5’-end and one at the 3’-end of the region of interest. After the annealing phase, the temperature will increase again to 95°C and the region of interest will be amplified. A copy of the target region was generated. This is happening for 40 cycles and each cycle will thus lead to a duplication or exponential amplification of the region of interest. These amplicons can be visualised by either using a fluorescently labeled probe or a fluorescent intercalating dye such as SYBR Green. This visualisation occurs after each cycle. When a fluorescent signal is detected, it means that the amplicon or genetic sequence of interest was present in the sample and that the target region was amplified. Scientists analyzing the performance of the real-time PCR will define a threshold based on curves of positive control samples. When the fluorescent curve is crossing this threshold, a Cycle of quantification (Cq (correct terminology) or Ct (frequently used abbreviation in the field) can be determined.
Pathogen loads and Cq values
Real-time PCR curves will cross the threshold already after a few cycles when the initial pathogen load in the sample of interest is high. When fluorescent signals are detected only after a large number of cycles, it means that the initial load of pathogen genetic material was low. The exact viral load in unknown samples can be deduced from a standard curve that was generated based on the Cq values and curves of samples with a known pathogen load. In a diagnostic report, the quantity of a pathogen is mostly illustrated as the Cq value instead of the absolute genome copy numbers of the pathogen because including a standard curve is costly. As 40 cycles of amplification are typically executed in a qPCR assay, it means that the corresponding Cq-value of detection can vary between 1 and 40 cycles. If a sample is negative, no detection should occur. In general, Cq values between 5 and 30 can be considered reliable. Especially high Cq values have to be interpreted cautiously. Above 35 cycles of amplification there is a risk that aspecific amplification (e.g. primer dimers) is being detected or that lab contamination is being picked-up.
Clinical relevance and Cq value interpretation
We also have to relate Cq values to the clinical signs observed by the veterinarian. Let us explain this by a practical example. Imagine a herd of young suckling piglets with acute diarrhea. Feces of piglets is collected at the onset of disease and analysed for rotavirus A by qPCR. When we detect rotavirus at a Cq value of 12, then this is indicative for a high viral shedding of rotavirus and potential clinical infection. Why? Because we know that rotavirus is only clinically relevant when shedding occurs at high viral loads. Detection of the same rotavirus A at a Cq value of 28 would have dramatically reduced the clinical relevance. This difference in Cq value of 16 cycles corresponds to an approximate 105-fold difference in pathogen load between the two samples. This means that rotavirus A, although detected here, was likely not causing the disease in this animal/herd.
The importance of sample collection at the right moment
Not only is the Cq value important for the interpretation, we also have to take into account the moment of sample collection in the phase of the disease. It is very important to collect samples in the acute phase of the infection to draw conclusions on the clinical role of a pathogen found at that moment. For some viruses, such as influenza virus, the time-window for a proper diagnosis is very short with approximately 2 to 3 days. This means that the diagnosis can be easily missed when the samples were collected too late after onset of disease. On the other hand, genetic material of pathogens can often be shed for several weeks at high Cq values/low pathogen loads. This does not always imply that pathogens are still infectious. High Cq values typically correspond to low infectivity and mostly this is because the genetic material in such samples is unprotected by a capsid, envelope or membrane… When clinical disease persists and we find such high Cq values for a given pathogen, we should for instance think of other reasons why the disease continues. If we have picked up a viral infection at a high Cq value, it is likely that bacterial infections have taken over the viral infections and that they should gain your attention.
Detection of infectious pathogens with PathoSense
You will now understand better that Cq value interpretation will help you in assessing the clinical relevance and the infectivity of the pathogen detected. This is also where we have to situate the important difference between PathoSense and real-time PCR. PathoSense uses ad-random nanopore sequencing of pathogen genetic material (DNA/RNA). This means that we don’t have to use specific primers like in real-time PCR and that a broad overview of the pathogens inside the samples can be given without prior selection. However, very important is the fact that at PathoSense all samples are being treated with an enzyme to destroy free-floating nucleic acids such as host genetic material. This treatment will also lead to the disruption of free genetic material of non-infectious pathogens. As a consequence, it means that pathogen DNA/RNA in samples testing positive in real-time PCR at high Cq value will be destroyed and will thus not test positive with PathoSense. The result will be that pathogens that are detected at the moment of sampling will very well represent the situation of what is happening in the animals or herd at that exact moment. It means that at the moment of sampling, the pathogen with the high Cq value was not relevant anymore, but that animals may require treatment for other pathogens that have been detected at the moment of analysis.
With this article we have refreshed the basics of real-time PCR and interpretation of Cq values. We also highlighted the key differences between real-time PCR and PathoSense. Always be very critical and look to the broader picture when performing diagnostic analyses in veterinary medicine.